

Between 2021-2023 Atlas English (a ClarityEnglish distributing partner) ran a joint project with HOPES LEB, an organisation that aims at improving the prospects for vulnerable Lebanese youth and Syrian and Palestinian refugees in Lebanon through education. The project consisted of delivering ClarityEnglish learning materials to HOPES LEB scholarship students.
We used the Dynamic Placement Test to assess the students’ English level at the start and end of the project. This, combined with data on student engagement, allowed us to analyse the effect of ClarityEnglish programs on the students’ English skills. This blog post summarises the findings of this analysis.
Report introduction
The demographic makeup of this group of students is outlined in the charts below.
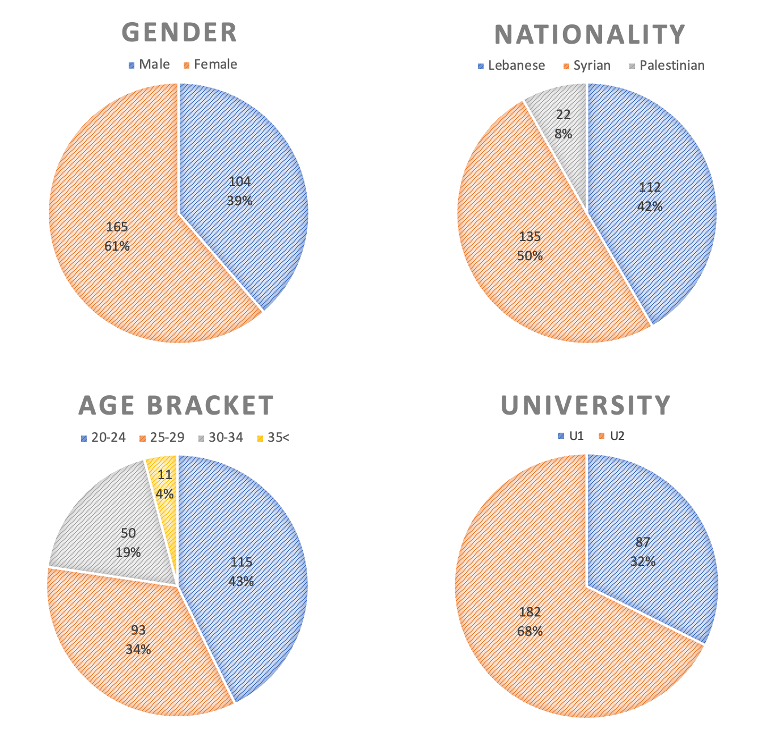
Figure 1: These charts break down the demographic makeup of the 269 HOPES LEB scholarship students that participated in the project. The names of the students’ universities were anonymised in the adaptation of the report.
The dependent variables analysed in the report are:
- Program engagement — the extent to which students engaged with the online courses will be analysed by two variables: the number of course completions, and the time spent learning.
- Change in English level — students completed an English test at the start and end of the project. The change in results will be used to assess any improvement in their English level.
The report will use students’ demographic details to assess if there were any differences in the engagement levels or learning outcomes between the various groups. These learning metrics will be analysed alongside some qualitative data, collected through a student survey, in order to assess the outcomes of the online English learning project.
Analysis I — Program Engagement
Table 1 summarises the statistical analysis carried out on the students’ engagement variables. The first row includes a key takeaway: the average levels of engagement for the whole group. On average, students completed 3.2 courses (out of a total of 7) and logged 3,608 minutes (approximately 60 hours) of online learning*. (*This only includes the time students spent logged in and learning on the ClarityEnglish online platform. The courses also include downloadable practice sheets and exercises which, as they are completed offline, are not counted in this metric.)
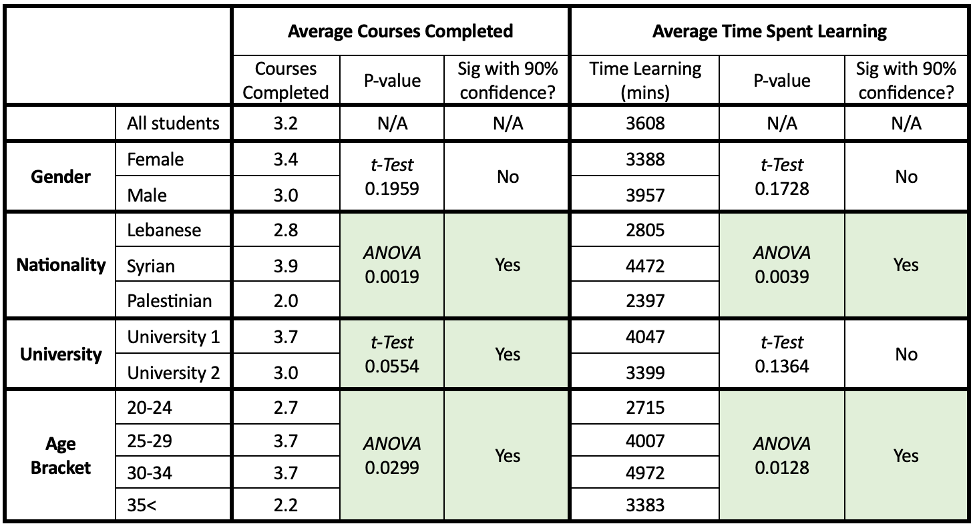
Table 1: This table represents the average learning inputs of each demographic group of students. The columns show the average metrics for each group, along with the p-value of the respective statistical analysis conducted, and whether the result is a statistically significant difference at the 90% confidence level (for which the cell is highlighted in green). For more detail on this statistical analysis please see Annex 1.
The same table also breaks down average engagement levels by demographic groups. This allows us to analyse trends — for instance, to see if there was any difference in engagement between female and male students. Importantly, simply looking at the average numbers is not enough to assess if the differences between groups are statistically meaningful. Various statistical tests need to be run to make comparative statements with confidence. [For readers unfamiliar with this type of statistical analysis, please refer to Annex 1 for some context.]
Gender: While there were some small differences between male and female students in terms of course engagement, these differences were not statistically significant. The data doesn’t support the assertion that there was any difference in course engagement between male and female students.
Nationality: There were, however, quite large differences in engagement metrics between students of different nationalities. Syrian students completed an average of 3.9 courses and 4,472 minutes (75 hours) of learning. These learning metrics were far above the engagement levels from Palestinian or Lebanese students. ANOVA tests carried out had a p-values of <0.01 — meaning that the observed differences are highly statistically significant.
University: While the differences between groups were not as pronounced as those between nationalities, there were also differences in learning inputs between universities. U1 students completed an average of 3.7 courses, while U2 students only completed 3.0. This difference was statistically significant at the 90% confidence level. [Note: while U1 students also spent, on average, more time learning
Age Bracket: Finally, Table 1 also illustrates the difference in engagement across students from different age brackets. Interestingly, students between 25-34 years of age proved to have similarly high engagement levels — higher than both the younger and older age groups.
Analysis II — Change in English level
Table 2 summarises the statistical analysis carried out on the students’ test results. The table includes information on each group’s average Relative Numeric score from the first and second test, as well an analysis of whether any change is statistically significant.
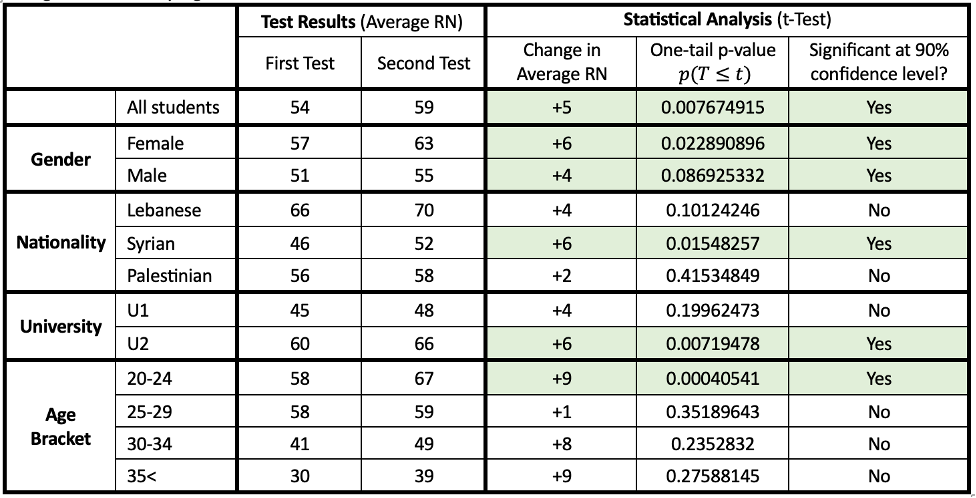
Table 2: This table compares the average DPT (Relative Numeric) score of the first and second tests, for each group of students. A t-test is used to analyse whether the change in Relative Numeric score is statistically significant at the 90% confidence level (in which case the cell is highlighted in green). For more detail on this statistical analysis please see Annex 1.
Perhaps most importantly, the first row illustrates the test results for the whole student group. Overall, the second DPT score was higher than the first, and this difference was highly statistically significant. The p-value of <0.01 means that the null hypothesis that there was no improvement in the students’ English level can be rejected with over 99% confidence. This means we can be highly confident that the students’ English level improved over the course of the project. Breaking the analysis down by demographic variables:
Gender: Both female and male students saw their English level improve over the course of the project. For female students, this improvement was statistically significant at the 95% confidence level, while for male students the improvement was statistically significant at the 90% confidence level.
Nationality: The same trend as with engagement metrics can be observed with the test result analysis. Syrian students saw a larger and more statistically significant improvement in their test results (at the 95% confidence level), while Palestinian students registered the least significant improvements. This is expected and would correspond with the groups’ engagement levels with the courses. It is interesting to note that the starting English level of Syrian students was significantly lower than either Lebanese or Palestinian students.
University: While students from both universities saw their test results improve, only the improvement of U2 students was statistically significant at the 99% confidence level. This is interesting as it is an inverse relationship to the one observed for students’ nationalities (where the group with higher course engagement saw a more significant improvement in test results).
Age Bracket: It is interesting to observe that students in the 20-24 age bracket saw the highest improvement in their test results (and the only improvement significant at the 99% confidence level) as the 25-34 age brackets saw higher engagement figures. This is perhaps explained by a confounding variable — familiarity with technology. It is anecdotally observed that younger students are often more adept at using mobile devices and educational technology, perhaps explaining why this group saw the most significant improvement in learning outcomes. However, this is only one possible explanation, for which there is currently no supporting evidence.
Discussion
Limitations
A significant limitation that should be considered is that DPT’s test construct was not the same for the scholarship students’ first and second tests. DPT underwent an update in Q4 2022, which increased the accuracy of the test by making higher levels more challenging. Students results across both tests can’t be accurately compared, as the test update means that — without any change to their English level — we would expect the second test to have yielded lower results. Fortunately, the fact that the average English level improved despite the update to the test construct means we can be confident that the improvement would have been even more pronounced had the test not been updated.
A second limitation is that this analysis was limited to the data available through the ClarityEnglish LMS. So, while it’s possible to analyse trends and differences between student groups, without any data about contextual factors it isn’t possible to make assertions about causal relationships in the data.
Conclusions
First and foremost, the students’ average English level improved over the course of the project, suggesting that the courses were effective. This is supported by qualitative data collected for a student survey, in which over 80% of students stated that the project has helped them improve their English level. As shown by Table 1 and Table 2, on average students spent 60.1 hours learning and registered a +5 point improvement in their Relative Numeric score. This corresponds with +25% of a CEFR band. (As stated Limitations, the actual average improvement is likely to be greater.)
These levels of improvement are consistent with the findings of research carried out by Cambridge University Press, which found that learners typically need 180-260 hours to improve by one CEFR band (from B1 to B2). It should be noted, however, that the figure from CUP was for the ‘average’ English learner. The scholarship students in this project, being native Arabic speakers, would have found it relatively harder to improve than the average learner. This is due to the well documented challenges that Arabic speakers face when learning English, given the different alphabet, grammatical structures, and sounds in pronunciation. Thus, we can be confident that the scholarship students in this project improved their English level by a more significant margin than would have been expected given the CUP research.
The second key takeaway was that Syrian students saw the highest levels of course engagement, and correspondingly the most significant improvements in their English level. As stated in Limitations, it can’t necessarily be concluded that their nationality had any direct effect on the learning outcomes. Perhaps their lower starting English level provided more motivation to study than Lebanese or Palestinian students. Alternatively, perhaps the background of these students (being refugees from the Syrian crisis) affected their motivation to study; perhaps they benefitted from better educational resources or a more flexible schedule. Further research would be needed to examine this relationship.
Lastly, while students between 25-34 years of age showed the highest levels of engagement with the learning materials, the younger group (20-24) showed the most significant improvements in English level. This might be due to an increased level of familiarity with mobile technology or online learning, but there is currently no supporting evidence for this. Further research would be needed to draw any conclusions with confidence.
Annex 1 — Short explanation of statistical analysis
When comparing the sample means of two groups, it is likely that there will be some differences between them. What is of interest is whether the differences are so pronounced that we can infer something about the populations from which the samples are drawn. For example, if comparing the average English test result of the same group of students a year apart, it’d be highly unlikely for this figure to be identical both times. However, we might be interested in understanding whether there really is a meaningful difference in the English level of the group. We can do this with a t-test.
With the t-test we compute a standardised difference between the two average test results. If there is a difference between them, we can conclude that either:
- the English level of the population hasn’t changed, a difference is simply observed due to chance, or
- there is a meaningful (‘statistically significant’) change in the English level of the population.
As the difference between the average test results increases, option 1 becomes less likely, and option 2 becomes more likely. For example, consider +6 point improvement in the average test results of female students. A t-test was run to assess whether this result was more likely to be due to chance, or due to an improvement in their English level. The p-value of 0.02289 tells us that, if there really had been no change in the English level, the probability of seeing these results is 2.289%. Logically, the inverse to this tells us that the probability that English level has improved is 97.711%. Thus, we can reject the ‘null hypothesis’ that there has been no change to their English level with 98% confidence.
While efforts were made to keep the language used in this report as straightforward as possible, due to the analyses run some references are made to p-values and confidence levels.
